Feature
Know exactly who's scanning, and how it's working
Every scan logged and rolled up into dashboards you can actually act on - per code or across your whole organization.
Feature
Every scan logged and rolled up into dashboards you can actually act on - per code or across your whole organization.
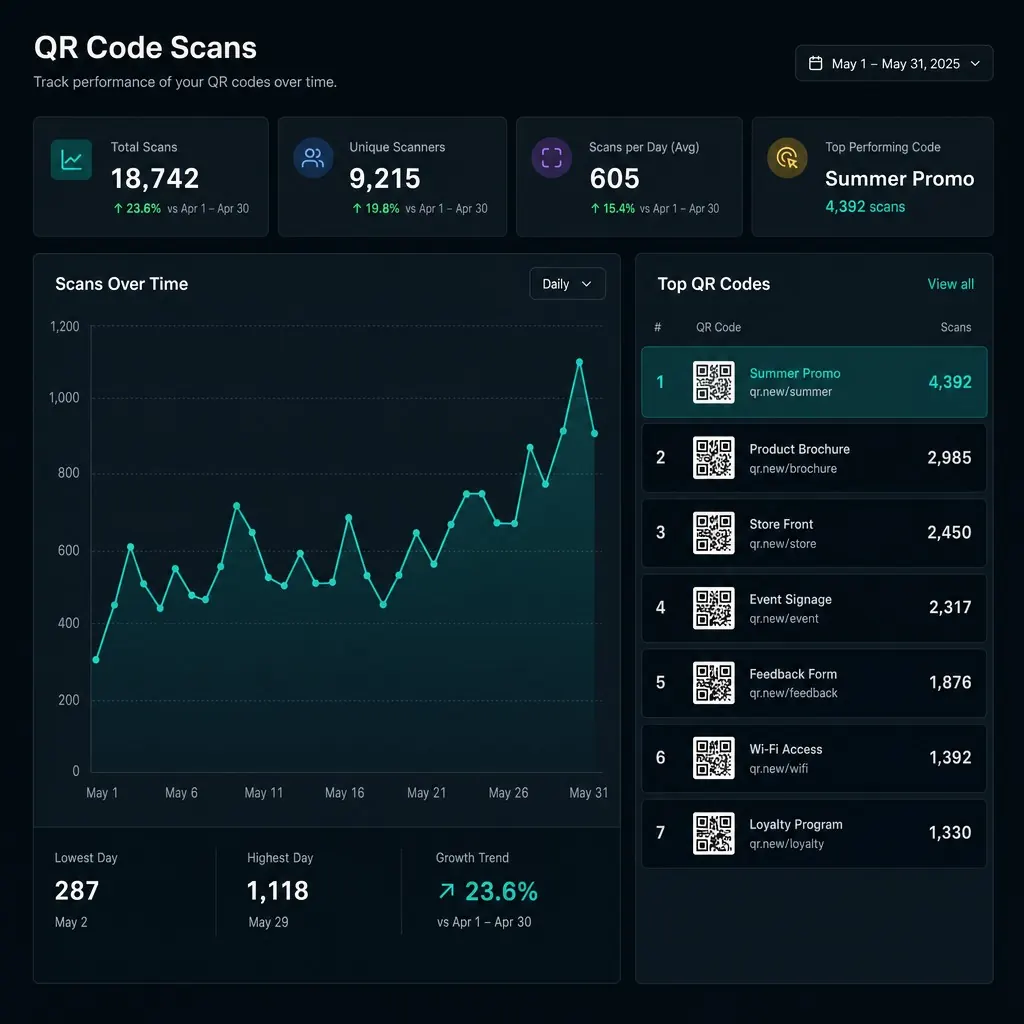
QR Hero logs analytics automatically on every scan — location, device, time, and unique vs. repeat — rolled into dashboards you can filter per code or across your whole organization.
A QR code without scan data is a leap of faith. Printed on packaging, a menu, or a flyer, it either works or it doesn't - but without analytics, there's no way to know which, or to make an informed call about where to keep investing print budget versus redesigning what isn't landing. That gap is common: only 1 in 8 marketers currently connects their QR scan data to revenue impact, per Uniqode's State of QR Codes 2026 report (April 2026) - usually a tooling problem, not a data problem.
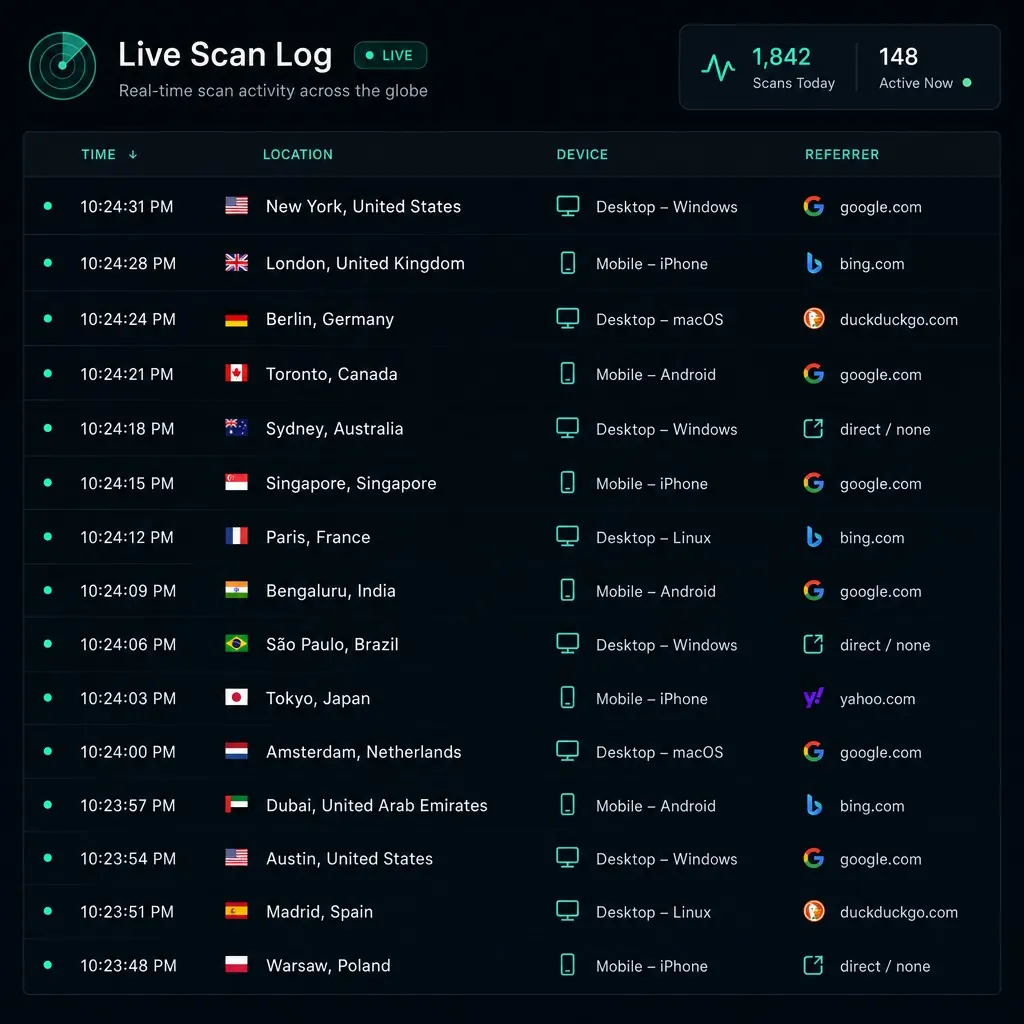
Every scan against a QR Hero code logs automatically: timestamp, coarse location, device type, and referrer, with no setup required on your part. That raw data rolls into dashboards you can actually use - per individual code, or rolled up across your whole organization - so a trend like a spike after a campaign, or a code that's quietly gone cold, is visible immediately instead of buried in guesswork.
From there, the same scan data exports as CSV or through the API for your own reporting stack, and pairs directly with A/B testing to show which destination variant actually converts, not just which one you assumed would. Retention scales by plan, from a week of history up to five years, and UTM tagging plus ad-pixel support means the same QR code analytics can feed straight into your existing marketing measurement, not sit in a silo next to it.
Scan analytics get more useful once you're also using Dynamic links to test destinations or Scheduling & A/B testing to compare them directly, and teams building their own dashboards can pull the same numbers through API access.
Without scan data, you're guessing whether a code earns attention.
Time, location, device, and referrer - no setup required on your part.
Per-code or org-wide, so you can see exactly what's working.
No setup - timestamp, coarse geo, device, referrer, unique vs repeat.
Per-code or org-wide: over time, by geo, by device, top performers.
CSV or API access to the raw data for your own reporting.

Automatic per-scan logging
Timestamp, coarse geo, device, and referrer - no setup required.
Unique-vs-repeat signal
A best-effort visitor signal on top of raw scan counts.
Per-code and org dashboards
Trends over time and top-performing codes.
CSV and API export
The raw data for your own BI or reporting stack.
Retention scales by plan
30 days on Starter up to 5 years on Enterprise.
Pairs with A/B testing
See which variant actually wins, not just a guess.
Advanced UTM tracking
Auto-tag destinations for Google Analytics and ad platforms.
Tracking pixel support
Fire Meta, Google, or other ad pixels on scan, alongside native analytics.
Put it to work on your next print run
Your first dynamic code is live in minutes, on your own domain.
It's a best-effort signal based on device and session characteristics at scan time - treat it as a strong indicator of repeat vs new visitors, not a guaranteed individual identity.
Yes - CSV export and API access are both available, so you can pull raw scan data into your own BI stack.
Retention scales by plan: 30 days on Starter, 90 days on Business, 1 year on Professional, and 5 years on Enterprise. See Pricing for the full breakdown.
No - logging happens asynchronously after the redirect fires, so the person scanning isn't waiting on analytics to be recorded.
Common pairings for teams that report on performance.
See this feature in context, industry by industry.
Your first dynamic code is live in minutes, on your own domain.